A device’s IV curve – current versus voltage curve – is a graph of the current that will flow in the device as a function of the voltage across it.
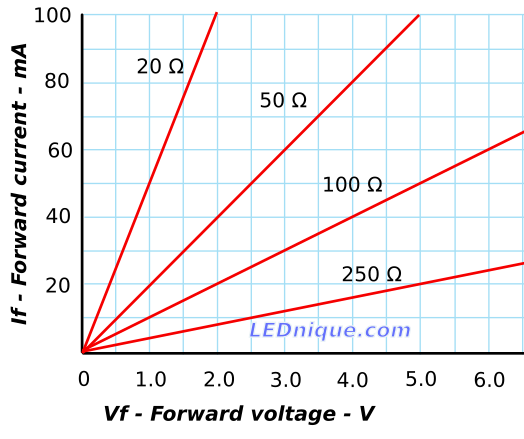
Figure 1. IV curves for various resistors. The lines can be extended through 0, 0 to show the relationship at negative voltages and currents.
As suggested by Ohm’s Law, \( V = IR \), the relationship between current and voltage in a resistor is linear. Figure 1 clearly shows that the current increases linearly with increasing voltage and that the rate of change depends on the value of the resistor.
LEDs are rather different:
LEDs are diodes whose P-N junctions behave in a non-linear fashion. Very little current flows until the forward voltage is reached. Above this value the current increases exponentially with increasing voltage.
LEDs like all diodes conduct in one direction and do not (until the reverse breakdown voltage is reached) conduct in the opposite direction.
As LEDs’ colour is determined by the band gap1 of the semiconductor and the forward voltage, \(V_F\), also varies with the material.
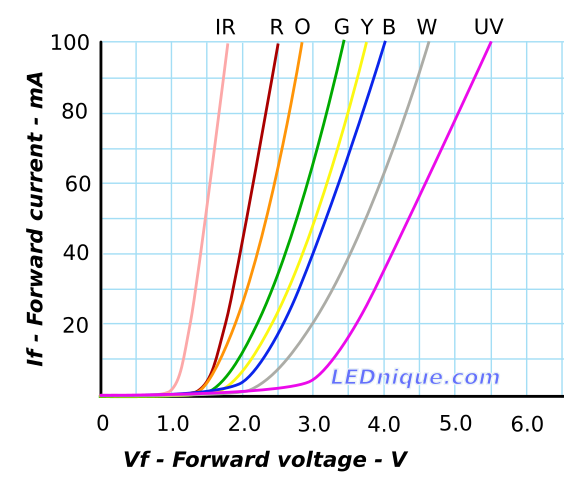
Figure 2. Typical IV curves for various colours of LEDs.
The IV curves are useful for estimating the current that will flow at particular voltages, etc., and for calculating resistor values.
There are a few points worth noting from the curves:
The forward voltage matches the band gap which increases from red to violet.
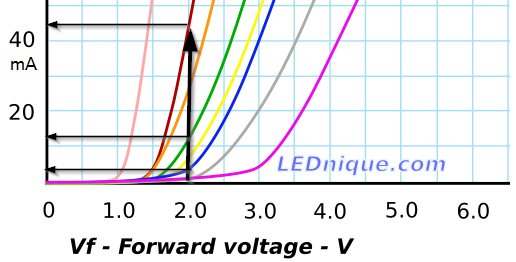
It should be clear that trying to power LEDs in parallel – not recommended normally – is particularly bad idea when the colours are mixed. e.g. Connecting a red, green and blue LED in parallel on a 2.0 V supply would result in:
Red: 44 mA.
Green: 12 mA.
Blue: 3 mA.
Figure 3. The currents that would flow through a red, green and blue LED connected directly to a 2 V supply.
The red would hog the majority of the current.
IR (infra-red) LEDs have the lowest forward voltage.
Note that in this chart the curves have been extended up to 100 mA. Most small indicator LEDs cannot take this current. See LED current rating.
Plotting an IV curve
This video demonstrates measurement of the current through a green LED as voltage is adjusted. The results are plotted to generate the IV curve for the LED.
It is also possible to observe some shimmer on the multiplexed display while humming. Humming vibrates the eyes in their sockets which can create stroboscopic conditions within the eye. By humming at about 70 to 72 Hz (near music note C2) I was able to observe shimmer on the LED display.
Measuring LED forward voltage
The video clip above demonstrates measurement of LED forward voltage using a multi-function component tester. Results were:
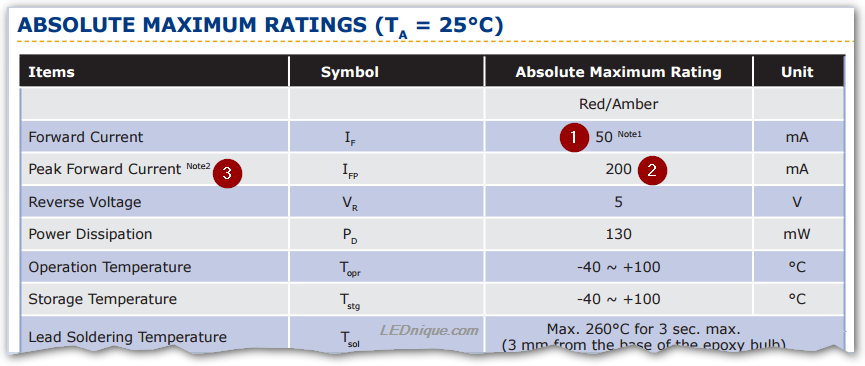
Maximum continuous forward current is 50 mA (1). Take note that this is an absolute maximum rating and is quoted at 25°C. If running in a higher temperature environment the current will have to be reduced to prevent overheating. We should also read Note 1:
1. For long term performance the drive currents between 10mA and 30mA are recommended.
Peak forward current is quoted at 200 mA (2). To understand this we need to read Note 2:
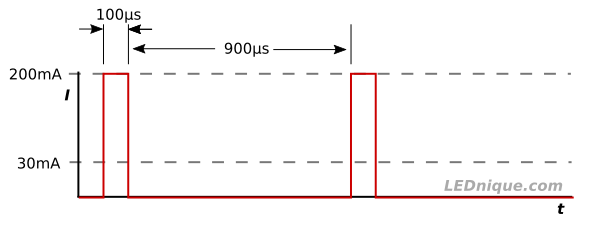
2. Pulse width ≤0.1 msec, duty ≤1/10.
The C503B maximum duty cycle at maximum peak current.
Some applications such as multiplexed displays the LEDs are blinked on and off fast enough that the eye can’t see. To keep the average light-levels high a very high current pulse is given. In the example above we can see that the pulsed current’s average value is 200 \( 200m \frac {100\mu}{100\mu + 900\mu} = 20 \mathrm mA\). It should end up comparable with the LED run at about 20 mA continuously.
Other applications for pulsed LEDs include strobes and camera flash units.
Ohm’s law states that the current through a resistive conductor (a resistor) between two points is directly proportional to the voltage across the two points.
\(I={\frac {V}{R}}\) where I is current (amps or A), V is voltage (volts or V) and R is resistance (ohms or \(\Omega\)).
Example 1 – resistor calculation
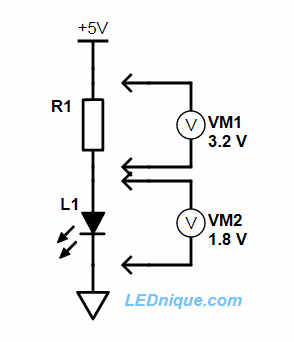
Figure 1. Series connection of a resistor and LED. The voltmeters show the voltage drop across each element of the circuit.
I have a 5 V supply and I want to run a red LED at 8 mA.
We can see from the LED’s IV curve that at 8 mA the red LED will have a forward voltage of 1.8 V. That means there’s 5 – 1.8 = 3.2 V across the resistor. Using Ohm’s law we can calculate the resistance.
390 \(\Omega\) is the closest standard value and that will be fine.
Don’t forget to check the power rating of the resistor! See Power calculations.
Notes
Note that the order of the components in this example doesn’t matter. The resistor can go between the +5 V supply and the LED or between the LED and ground. The same current will flow through the circuit and the same voltage drop will occur on the LED.
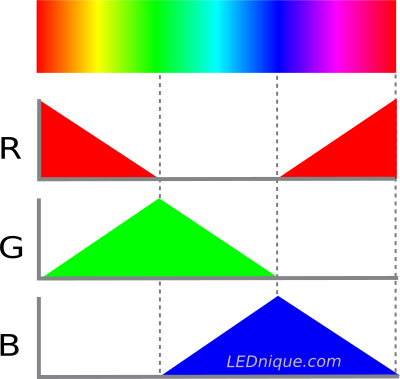
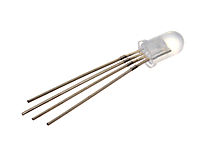
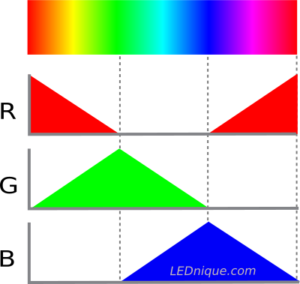
LEDs give off monochromatic light at a frequency determined by the semiconductor material. An RGB LED (Red-Green-Blue) combines LEDs of the three primary colours to give a full colour spectrum.
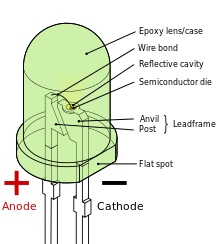
Figure 1. An RGB LED in a 5mm package. Note one lead per LED anode and a common lead for the cathodes.Figure 2. By cross-fading the colours an RGB LED can generate a wide color spectrum by mixing light.
A light-emitting diode semiconductor light source. It is a p–n junction diode, which emits light when activated.
Quick points
LEDs are semiconductors.
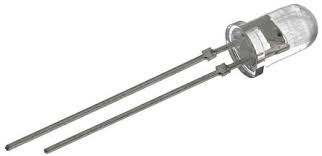
LED component parts.
The ‘D’ stands for ‘diode’. They only conduct current in one direction so they have a positive and a negative terminal.
The colour of the LED light depends on the specific semiconductor used in the LED chip.
The plastic body is usually coloured to enchance the colour emitted but clear bodied LEDs are common and, of course, essential for white LEDs.
Unlike regular bulbs, LEDs generally require current limiting to prevent damage.
Technical
When a suitable voltage is applied to the leads, electrons are able to recombine with electron holes within the device, releasing energy in the form of photons. This effect is called electroluminescence, and the color of the light (corresponding to the energy of the photon) is determined by the energy band gap of the semiconductor.
An LED is often small in area (less than 1 mm²) and integrated optical components (lenses) may be used to shape its radiation pattern.
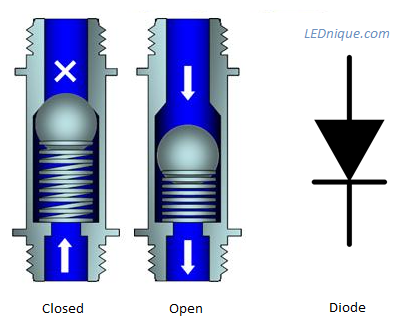
LED -> diode -> non-return valve
LEDs are diodes (that emit light). Diodes are electrical non-return valves. ((What Americans call “tubes” the English call “valves”. This is due to their rectification properties and that they behave like a certain type of valve in a water system.))
The diode check-valve analogy.
If you look at the check-valve in the figure above, it should be clear that the spring normally keeps the ball in position and prevents back-flow. When “forward-biased” the ball shut-off can be moved against the spring but it will take some initial pressure to move the ball. This results in a pressure drop across the valve: the pressure downstream will be less than the inlet pressure.
In a similar manner the PN junction causes a voltage drop. For silicon it is about 0.7 V. Since there is a PN junction in the base-emitter of your transistor you can expect a 0.7 V drop across it when forward biased.
Pushing the analogy a little further, we can also see that further pressure drop will occur due to the constriction of the valve. The more water we push through the valve the more the pressure will drop. This will be added to the initial pressure drop required to open the valve in the first place. The resultant pressure drop graph will look remarkably like one of the I vs V curves below.