A device’s IV curve – current versus voltage curve – is a graph of the current that will flow in the device as a function of the voltage across it.
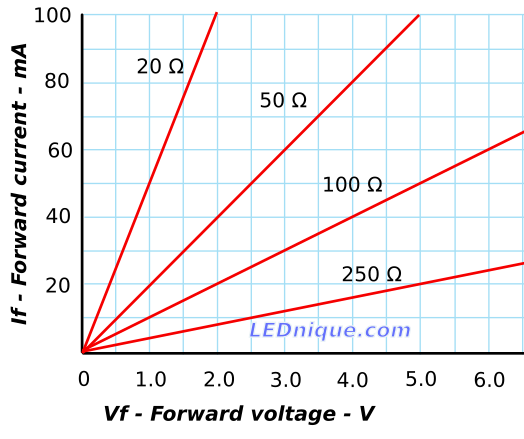
As suggested by Ohm’s Law, \( V = IR \), the relationship between current and voltage in a resistor is linear. Figure 1 clearly shows that the current increases linearly with increasing voltage and that the rate of change depends on the value of the resistor.
LEDs are rather different:
- LEDs are diodes whose P-N junctions behave in a non-linear fashion. Very little current flows until the forward voltage is reached. Above this value the current increases exponentially with increasing voltage.
- LEDs like all diodes conduct in one direction and do not (until the reverse breakdown voltage is reached) conduct in the opposite direction.
- As LEDs’ colour is determined by the band gap1 of the semiconductor and the forward voltage, \(V_F\), also varies with the material.
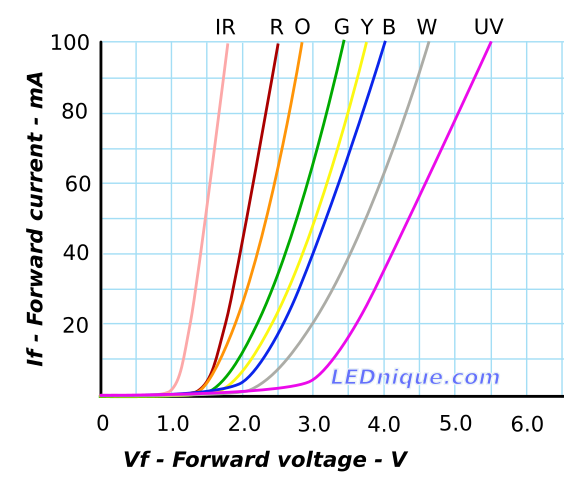
The IV curves are useful for estimating the current that will flow at particular voltages, etc., and for calculating resistor values.
There are a few points worth noting from the curves:
- The forward voltage matches the band gap which increases from red to violet.
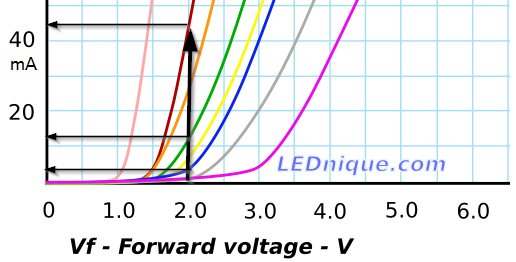
- It should be clear that trying to power LEDs in parallel – not recommended normally – is particularly bad idea when the colours are mixed. e.g. Connecting a red, green and blue LED in parallel on a 2.0 V supply would result in:
- Red: 44 mA.
- Green: 12 mA.
- Blue: 3 mA.
-
-
- The red would hog the majority of the current.
- IR (infra-red) LEDs have the lowest forward voltage.
Note that in this chart the curves have been extended up to 100 mA. Most small indicator LEDs cannot take this current. See LED current rating.
-
Plotting an IV curve
This video demonstrates measurement of the current through a green LED as voltage is adjusted. The results are plotted to generate the IV curve for the LED.
It is also possible to observe some shimmer on the multiplexed display while humming. Humming vibrates the eyes in their sockets which can create stroboscopic conditions within the eye. By humming at about 70 to 72 Hz (near music note C2) I was able to observe shimmer on the LED display.
Measuring LED forward voltage
The video clip above demonstrates measurement of LED forward voltage using a multi-function component tester. Results were:
| Colour | \(V_F\) |
| Infrared | 1.14 V |
| Red | 1.76 V |
| Yellow | 1.85 V |
| Green | 1.96 V |


